
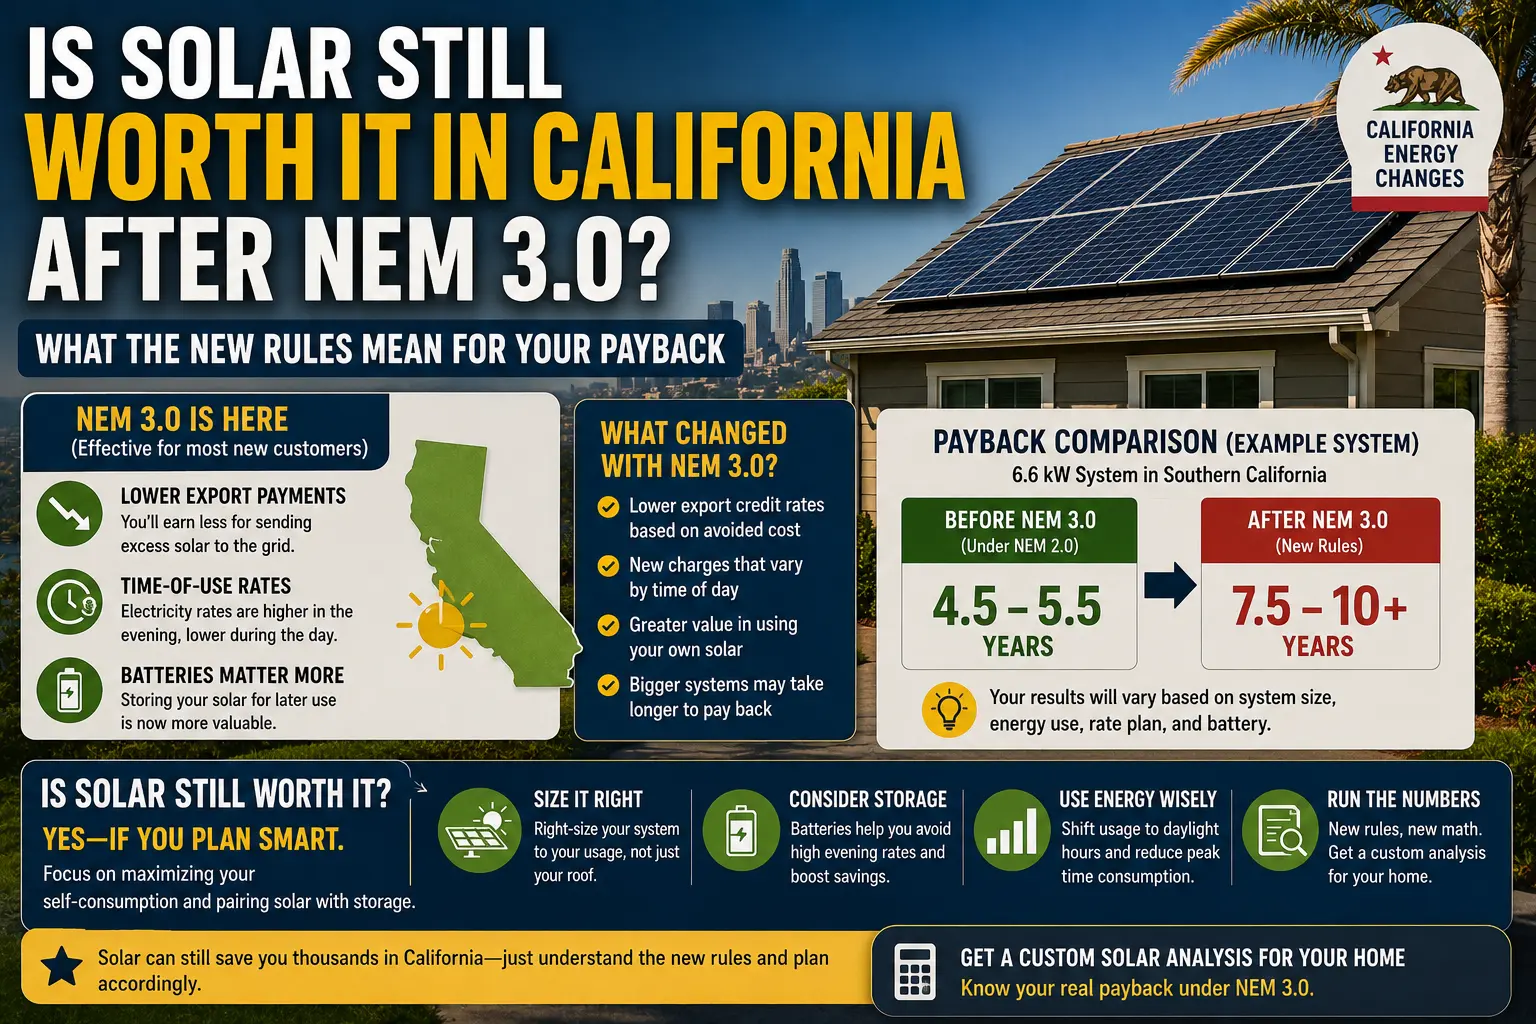

75%. That’s roughly how much California’s export credit rate was cut when NEM 3.0 took effect in April 2023.
Under the old net metering rules — NEM 2.0 — California homeowners who sent excess solar power back to the grid were credited at close to the full retail rate. On PG&E’s territory, that meant credits worth $0.30–$0.35 per kWh exported. Under NEM 3.0, that same exported power earns what’s called an “Avoided Cost Calculator” rate — typically $0.04–$0.08 per kWh depending on time of day. Same panels, same roof, dramatically different credit.
This is the single biggest policy shift in US residential solar in a decade. And depending on when you’re reading this, it either affects your existing system or is the most important variable in deciding whether to install one now.
Here’s what the numbers actually look like — without the installer spin.
NEM 2.0 vs. NEM 3.0: What Actually Changed
Under NEM 2.0 (for systems interconnected before April 15, 2023):
- Excess solar exported to the grid credited at near-retail rate
- Oversizing your system to bank credits was a viable strategy
- Payback periods in California: typically 5–7 years
- Battery storage was optional — the grid functioned as your “virtual battery”
Under NEM 3.0 (for new interconnections after April 15, 2023):
- Export credits paid at time-varying “avoided cost” rates — typically $0.04–$0.08/kWh
- Exporting excess power at midday earns very little (the “duck curve” problem — lots of solar on the grid at noon, low wholesale value)
- Export credits spike in early evening (5–9 PM) when solar production drops but grid demand peaks
- Battery storage is no longer optional if you want meaningful bill savings — it’s central to the economics
- Payback periods for solar-only systems: now 9–13 years in many California markets
The California Public Utilities Commission published detailed documentation on the NEM 3.0 structure including the rate schedules by utility. It’s dense reading, but the core message is simple: exporting power is no longer nearly as valuable as it was.
Does This Mean California Solar Is Dead?
No. But it means the system has to be designed completely differently than it was under NEM 2.0.
Under NEM 2.0, the strategy was simple: install enough panels to cover 100–110% of your annual usage, export the excess at retail rate, let credits accumulate. Battery optional.
Under NEM 3.0, the strategy is: install panels sized to cover your daytime self-consumption, pair with a battery to shift that stored energy into the high-rate evening window, and minimize exports because they’re worth very little at midday. The system functions more like a self-contained energy management setup than a grid-connected credit machine.
The good news: California’s retail electricity rates are among the highest in the country. PG&E residential rates have exceeded $0.35/kWh on average tiers, and time-of-use peak rates run $0.55–$0.65/kWh during evening hours. Every kWh your battery discharges at 7 PM instead of buying from the grid at peak rate represents $0.55–$0.65 in savings — not $0.06 in export credit.
According to EnergySage’s 2024 California solar data, the average California homeowner with a properly paired solar + battery system under NEM 3.0 is still achieving payback periods of 7–9 years — longer than under NEM 2.0, but still well within the 25-year system life.
The Battery Is No Longer Optional in California
This is the part most California solar shoppers in 2025 need to internalize before they request a single quote.
Under NEM 3.0, a solar-only system in California has a payback period of 9–13 years. Add a properly sized battery, and that drops to 7–9 years. The battery earns its cost not through backup power — though that’s valuable too — but through time-of-use arbitrage: storing cheap midday solar and deploying it during expensive evening peak hours.
The math is very different from Texas, where I ran a detailed analysis of whether my Powerwall 2 was worth the $8,050 after-tax-credit cost. My Texas conclusion: battery ROI on bill savings alone is minimal, it’s primarily a resilience purchase. In California under NEM 3.0, that conclusion flips. The bill savings from peak-rate arbitrage are large enough that the battery genuinely shortens the overall system payback.
If you’re getting solar quotes in California right now and any installer is pitching you a solar-only system without explaining why battery pairing changes the economics under NEM 3.0 — that’s a red flag worth paying attention to.
NEM 2.0 Grandfathering: The Clock Is Ticking
If you have an existing NEM 2.0 system, you’re grandfathered on your current rate structure for 20 years from your interconnection date. A system installed in 2021 stays on NEM 2.0 rules until 2041. This is a genuine financial asset — and one of the strongest arguments for not delaying a California solar decision any further if you’re in a market where it makes sense.
The interconnection date is what matters, not the installation date. Which means even if you move quickly, you need to get your utility interconnection application submitted and approved before NEM 2.0 grandfathering becomes irrelevant — which it already has for new installs. This window is closed for new customers.
California’s Additional Incentive Stack
Despite the NEM 3.0 headwinds, California still has the most comprehensive solar incentive structure in the country outside of the federal credit.
Federal IRA credit: 30% of system cost, same as all US states. On a $35,000 California solar + battery system, that’s $10,500 back.
California Self-Generation Incentive Program (SGIP): Battery-specific rebate, currently offering up to $1,000/kWh for qualifying residential storage in disadvantaged communities and equity-eligible households, and $200–$400/kWh in standard residential tiers. A 13.5 kWh Powerwall could qualify for $2,700–$5,400 in SGIP rebate depending on eligibility. Funding is available in tranches — check DSIRE’s California incentives database for current availability.
Property tax exclusion: California excludes solar system value from property tax assessment through 2025, with likely extension. Same mechanic as Texas — significant value over the system life.
Low-Income programs: CARE/FERA rate discount programs and the new SASH (Single-family Affordable Solar Homes) program for income-qualified homeowners can dramatically improve the economics for qualifying households.
What California Homeowners Should Do Right Now
Decide on battery first, not panels. Under NEM 3.0, the battery isn’t an add-on — it’s central to the system design. Determine your storage needs before sizing panels. An installer who sizes panels first without discussing battery integration is working from an outdated playbook.
Check your SGIP eligibility. The battery rebate in California is meaningful enough to change whether battery storage pays off, and it’s income-tiered, so many more households qualify than assume they do. Run the numbers before assuming it doesn’t apply to you.
Get quotes from installers who specialize in NEM 3.0 system design. The optimization under NEM 3.0 is genuinely different from NEM 2.0, and not every installer has updated their approach. Ask specifically: “How do you optimize panel size and battery capacity for NEM 3.0’s export rates?” A vague answer is telling.
Run the comparison against your specific utility rate. PG&E, SCE, and SDG&E have different TOU structures and different peak windows. The battery dispatch strategy that maximizes savings under SDG&E’s EV-TOU rate is not the same as what works under PG&E’s E-TOU-C rate. The math is worth doing specifically, not generically.
The Bottom Line for California in 2025
Solar in California is still worth it — but the economics require a battery, and the system design requires more sophistication than it did under NEM 2.0. A homeowner who treats this the way I treated my Texas install — specific requirements, comparable quotes, real line-item analysis — will still find a strong financial case. Someone who calls one company and signs the first proposal is likely to get a system that performs significantly below its potential under the new rules.
The fundamentals haven’t changed: California has high rates, excellent sun, and a strong incentive stack. What changed is how you capture the value from those fundamentals.
Compare this to how the math worked out in Texas — where strong sun and rising rates make solar compelling despite weaker net metering — and you start to see a pattern: the what is almost always yes. The how is where the details matter.
— Allen
