
The first time I pulled up twelve months of my electricity bills to prepare for solar quotes, I realized I had no idea what I was actually paying per kilowatt-hour. I’d been paying the bill for eight years and couldn’t have told you the rate without looking it up.
Most people know their total monthly payment. Almost nobody knows their blended rate per kWh, their fixed charges, or their 12-month consumption range — which are the three things an installer needs to build an accurate savings estimate for your home. When I got quotes without having this information ready, I noticed the estimates varied wildly. When I got quotes with real consumption data and a clear understanding of my rate structure, the estimates converged and made sense.
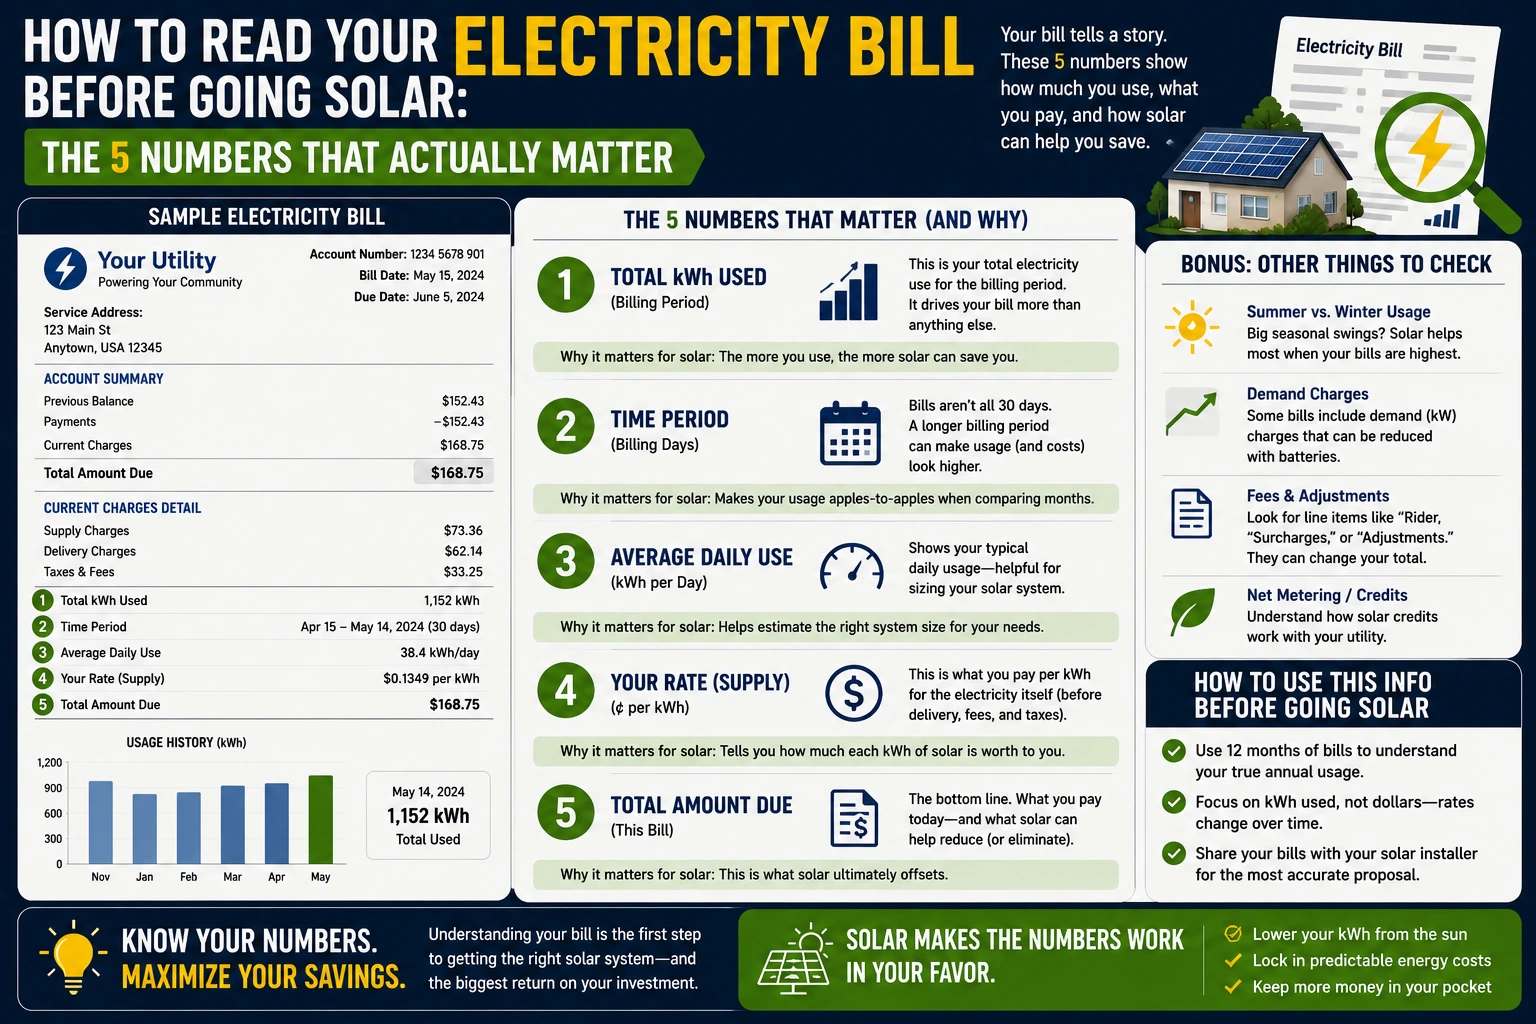
Here are the five numbers to pull from your bill before you talk to a single installer.
Number 1: Your Total Annual kWh Consumption
Not last month’s usage. Not your highest summer month. The full twelve-month total.
This is the primary input for system sizing. Solar production estimates are calculated on an annual basis, and a system sized to cover, say, 90% of your annual consumption needs to know what that annual consumption actually is — not an estimate based on one or two months.
Where to find it: Your utility’s online account portal almost always shows 12-month or 24-month usage history as a bar chart or table. Look for “usage history,” “energy use,” or “my account” sections. If your utility has a smart meter (most do now), you can often download hourly interval data going back 12–24 months.
My Austin Energy portal shows month-by-month kWh usage for the past two years. My 12-month total before solar was 9,148 kWh — which became 12,405 kWh after adding the Bolt EV. That 3,257 kWh difference is exactly why telling your installer about a current or planned EV changes the system size calculation meaningfully.
What to do with it: Write down each month’s usage and the 12-month total. Note which month was highest (peak cooling or heating month) and which was lowest. The ratio between peak and average matters for sizing decisions.
Number 2: Your Blended Rate Per kWh
Your effective cost per kilowatt-hour — what you’re actually paying, on average, for each unit of electricity consumed.
This sounds simple but often isn’t, because electricity bills contain multiple charges that aren’t all labeled “electricity rate.” To find your true blended rate:
Total bill amount ÷ Total kWh used = Blended rate
For example: if your bill is $147 and you used 1,100 kWh, your blended rate is $0.134/kWh.
Why this matters: Installer savings estimates should use your actual blended rate, not the utility’s published base rate. Most utility bills include charges that aren’t technically the “energy rate” — fuel adjustment charges, distribution charges, transmission charges, renewable energy riders — but that you pay proportionally based on how much electricity you consume. All of these go away (or are reduced) when you consume less electricity through solar. Your blended rate captures all of them.
A common error: installers who use only the published base energy rate (often $0.08–0.10/kWh) instead of the true blended rate ($0.12–0.18/kWh for most US customers) will understate your annual savings by 20–40%. This makes payback periods appear longer and the system look less attractive — paradoxically underselling solar by using an inaccurate input.
Tiered rates complicate this: Some utilities charge different rates for the first X kWh per month and a higher rate for usage above that threshold. If you’re consistently in the higher tier, your effective marginal rate on what solar eliminates is the higher tier rate — which means the solar savings are even better than the blended rate suggests. Ask your installer to model this specifically if your utility uses tiered pricing.
Number 3: Your Fixed Monthly Charges
The charges on your bill that stay the same regardless of how much electricity you use.
These go by various names: base charge, customer charge, service charge, grid connection fee, meter charge. They typically run $5–$25/month depending on utility. They are not reduced by solar — they’re the fixed cost of being connected to the grid, and they’ll still appear on your bill even if your solar system produces more than you consume.
Why this matters: Installers who promise to “eliminate your electricity bill entirely” with solar are either ignoring fixed charges or oversizing the system to run a large credit balance that offsets the fixed fee. Neither is always the right answer. You should know going in that your post-solar bill will not be $0 — it will be your fixed monthly charges plus any consumption from the grid beyond what your panels produce.
My Austin Energy fixed charges run about $14/month — $168/year. That’s the floor on my post-solar annual bill regardless of production. It’s the charge I can’t eliminate without physically disconnecting from the grid, which I don’t want to do.
Number 4: Your Peak Month Consumption
Your single highest monthly kWh reading from the past 12 months.
This tells you two things: how much your consumption varies seasonally, and whether your heaviest usage month is being driven by a load you might be able to control.
Why it matters for sizing: A system sized to your annual average production will have surplus months (spring, fall) and deficit months (peak summer or winter). Understanding the deficit month helps you and your installer discuss whether net metering credits from shoulder months offset the deficit month, or whether your rate structure makes that arithmetic complicated.
In Austin, my July consumption runs 40% above my annual monthly average because of AC. My installer modeled this specifically, showing me how summer production (also higher in July due to long days) offsets the elevated July consumption, and how my spring credits carry into summer billing. The analysis was more reassuring than just “annual production covers annual consumption” — seeing the month-by-month model made the economics tangible.
A red flag: If an installer gives you a single annual savings number without showing you a month-by-month production vs. consumption comparison, ask for it. If they can’t produce one, their modeling isn’t rigorous enough to trust.
Number 5: Your Rate Structure Type
Flat rate, tiered rate, or time-of-use rate — these are meaningfully different billing structures that affect how solar saves you money.
Flat rate: Single price per kWh regardless of when you use it or how much. The simplest to model for solar. Every kWh your panels produce is worth the flat rate in savings.
Tiered rate: Lower price for the first X kWh/month, higher price above that threshold. Common in California (PG&E, SCE) and some other utilities. Solar panels reduce your consumption from the highest tier first — meaning the first kWh solar saves you is worth more than average. This tends to make solar economics better than the blended rate calculation suggests.
Time-of-use (TOU) rate: Different prices at different hours of the day — typically lower at night and midday, higher in late afternoon and evening peak windows. I covered how TOU interacts with solar in detail. Short version: solar production happens mostly during off-peak and shoulder hours, which means solar self-consumption avoids mid-tier electricity costs, while peak-hour evening consumption still comes from the grid at premium rates — unless you have a battery.
Where to find your rate structure: Your bill’s rate schedule name (e.g., “Residential Rate R-1” or “TOU-D-Prime”) identifies it. Search that rate name on your utility’s website to find the full tariff document with the tier breakdowns or TOU schedules.
Putting It Together: The Pre-Quote Checklist
Before you contact a single installer, have this information ready:
- 12-month kWh total and monthly breakdown (from utility portal)
- Blended rate per kWh (total annual bill ÷ total annual kWh)
- Fixed monthly charges amount
- Peak month consumption and which month it is
- Rate structure type (flat, tiered, or TOU)
- Any planned changes: EV purchase, home addition, pool, new appliances
With this in hand, you’ll immediately be able to evaluate whether an installer’s production estimate and savings projection is using your actual numbers or generic assumptions. The wide spread I found across my six installer quotes partly reflected installers using different assumptions about my consumption and rate. The ones who asked for my bill data and used it produced more accurate projections than the ones who ran generic estimates.
The bill is the foundation of the whole solar analysis. Spend twenty minutes understanding it before any installer conversation starts — and you’ll be a more informed buyer than 90% of the people who sign solar contracts.
— Allen
