
How much does solar actually cost?
It’s the question every homeowner asks first, and it’s the one the industry does the worst job answering honestly. You’ll see ranges like “$10,000 to $50,000” on most sites — a spread so wide it’s useless. You’ll see per-watt averages that don’t account for the difference between premium and budget equipment. And you’ll almost never see anyone walk through the full cost calculation the way you’d actually do it yourself.
So here it is. Real numbers, current as of 2025, based on my own install and the data I’ve tracked since.
The National Average — And Why It Misleads
According to NREL’s residential solar cost benchmark data, the installed cost of residential solar in the US averaged approximately $3.00–$3.20 per watt in 2024, before any incentives. For a typical 8–10kW system, that puts the gross cost between $24,000 and $32,000.
But averages hide a lot. The actual number on your quote will depend on:
– System size — driven by your annual electricity usage in kWh, not your home’s square footage
– Panel tier — budget monocrystalline panels vs. premium (SunPower Maxeon, REC Alpha, Panasonic EverVolt) run $0.40–$0.70/watt more
– Inverter type — string inverter systems are cheaper upfront; microinverter systems (Enphase IQ8) cost more but perform better under partial shading
– Roof complexity — steep pitches, multiple facets, or tile roofs add labor cost
– Your state and installer market — California, Massachusetts, and New York run 15–25% above national average; Texas, Arizona, and Florida tend to be below
My 9.6kW SunPower Maxeon system with Enphase IQ8 microinverters in Austin came in at $28,400 — right at the top end of what I’d consider fair for that equipment tier in my market.
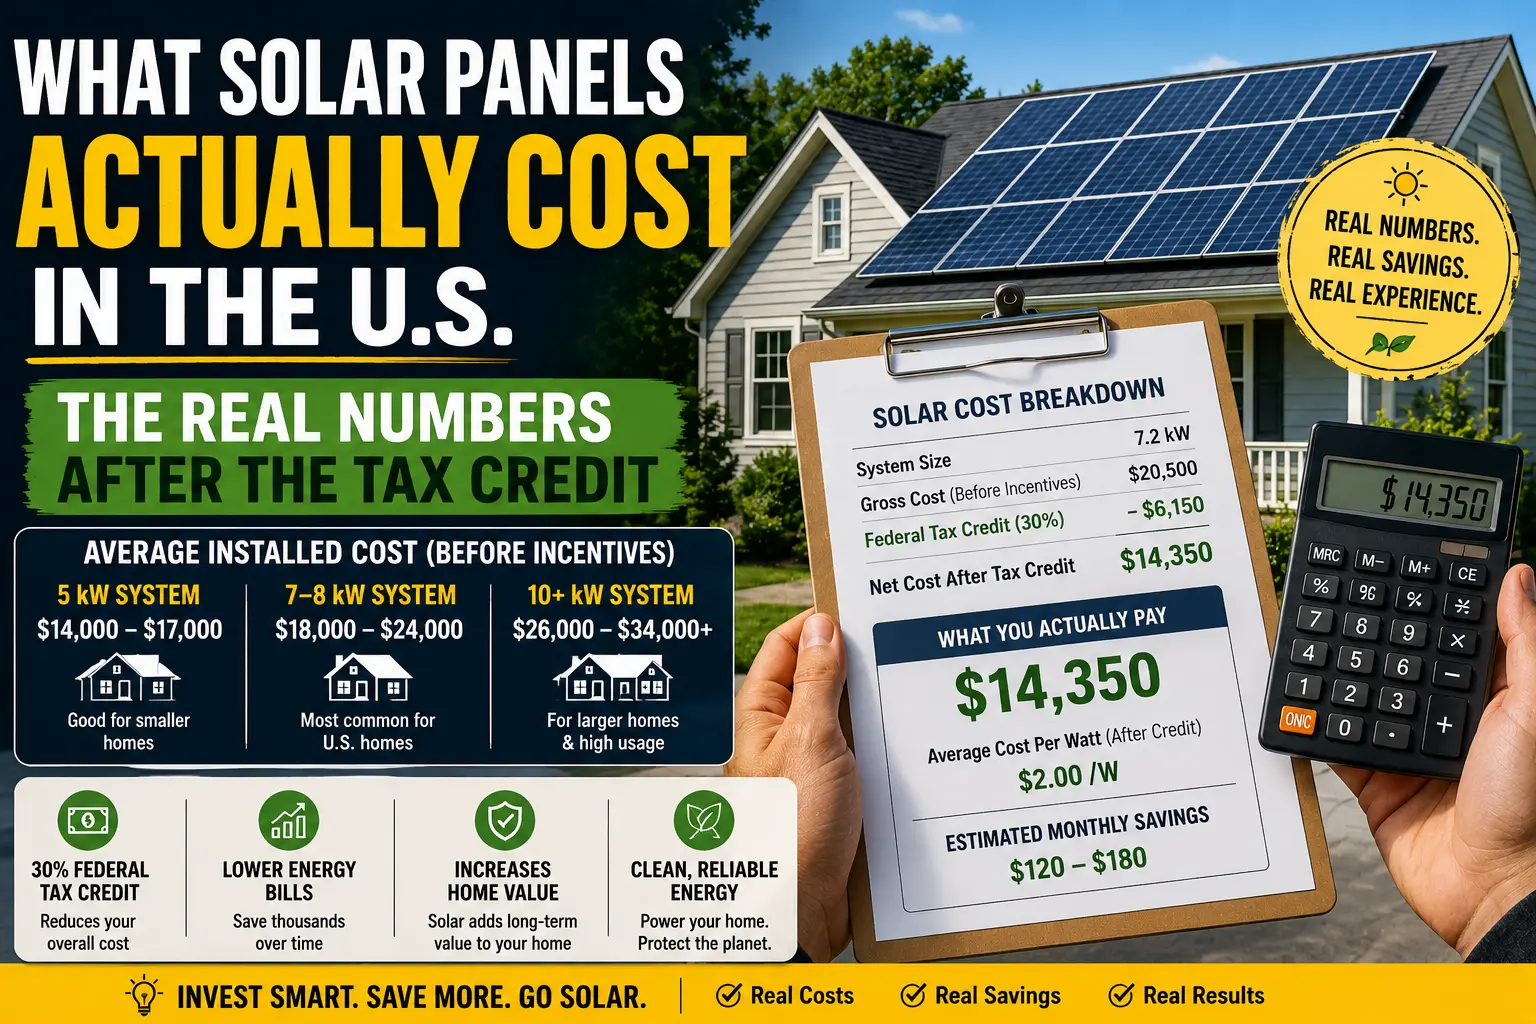
The Tax Credit Math (This Is the Part That Changes Everything)
The federal Residential Clean Energy Credit — part of the Inflation Reduction Act — gives you 30% of your total system cost as a direct credit against your federal tax liability. Not a deduction. A credit. Dollar for dollar off what you owe.
The IRS Residential Clean Energy Credit guidance confirms this rate is locked through 2032, then steps down to 26% in 2033 and 22% in 2034. There is no income cap. There is no lottery. If you buy (not lease) a solar system and you have federal tax liability, you qualify.
For my system:
– Gross cost: $28,400
– 30% IRA credit: –$8,520
– Effective out-of-pocket cost: $19,880
One important caveat: the credit applies to the tax year you install, not when you signed the contract. If your federal tax liability for that year is less than $8,520, you can carry the unused portion forward to the next year. This matters for retirees or anyone with lower taxable income — worth talking to your accountant before you sign anything.
What Your State Might Add On Top
The federal credit is the floor, not the ceiling. Many states and utilities layer additional incentives on top. The DSIRE database is the most complete source for what’s available in your state — I check it every time I’m writing about a specific market.
A few examples of what stacks in 2025:
– Texas — No state income tax means no state solar tax credit, but many Texas utilities (including Austin Energy) offer rebates of $2,500–$5,000 for qualifying installs
– California — The NEM 3.0 net metering changes reduced the credit rate for new installs, which changes the payback math significantly compared to pre-2023 installs
– New York — 25% state tax credit (capped at $5,000) on top of the federal 30%, making NY one of the strongest incentive stacks in the country
– Massachusetts — State tax credit plus one of the strongest SREC markets in the US; homeowners earn ongoing credits for every MWh their system produces
If you’re in a high-incentive state, your effective cost can come in well below $15,000 for an average-sized system. I’ve seen Massachusetts homeowners with a fully loaded incentive stack land at under $12,000 net cost on a 7kW system.
The Payback Calculation (Done Honestly)
Payback period gets thrown around carelessly. Here’s how to actually run it.
Step 1: Find your annual electricity savings. Take your current annual usage in kWh, multiply by your utility’s rate per kWh. If you use 12,000 kWh/year and pay $0.13/kWh, your current annual spend is $1,560.
Step 2: Estimate what solar covers. A correctly sized system should cover 90–100% of your usage. Let’s say it covers 95% — that’s $1,482 in annual savings.
Step 3: Divide your net cost by annual savings. $19,880 ÷ $1,482 = 13.4 years.
Wait — that’s longer than you usually see quoted, right? Most solar content advertises 6–8 year payback periods. The reason: they’re using higher utility rates, assuming net metering at full retail value, or basing the calculation on California or Massachusetts rates ($0.20–$0.35/kWh) and applying it nationally.
In Austin at $0.104–$0.129/kWh, my real payback came out to 6.8 years — but that’s specific to my rate, my usage, my Austin Energy net metering terms, and my system cost. Your number will be different.
The honest version of this calculation requires your actual utility rate. Pull it from EIA’s residential electricity rate data if you want the state average, or just look at your last 12 months of bills.
Premium vs. Budget Equipment: Is the Upgrade Worth It?
This is where a lot of homeowners get lost. The short answer: for most people, mid-tier equipment hits the sweet spot.
Budget tier (Canadian Solar, Jinko Solar, Risen): $2.50–$2.80/watt installed. Solid panels with 10–12% lower efficiency than premium. Fine if your roof has ample unshaded space.
Mid tier (REC Alpha, Q CELLS, Silfab): $2.90–$3.20/watt installed. Good balance of efficiency and warranty. Q CELLS in particular has strong US-based customer support.
Premium tier (SunPower Maxeon, Panasonic EverVolt): $3.40–$3.80/watt installed. Highest efficiency, best warranties, best degradation rates over 25 years. Worth it if your roof has limited south-facing space or if you expect to sell the home within 10 years — premium panels are a stronger selling point.
I chose SunPower for two reasons: limited usable roof space (540 sq ft south-facing) and the integrated 25-year warranty that covers product, performance, and labor under one entity. As I wrote about in my post breaking down the six quotes I received, the premium cost was justified by those specifics — not by a general assumption that premium is always better.
The Financing Question
If you finance rather than pay cash, the math shifts. A $19,880 system financed at 6.99% APR over 20 years carries a monthly payment of approximately $154 and a total interest cost of roughly $17,000 over the loan life.
That changes the payback equation entirely. You’re not saving $1,482/year free and clear — you’re saving $1,482 while paying $1,848 annually in loan payments. Net cash flow is negative until the loan is paid off.
This doesn’t make financing wrong. It makes the “your payment is less than your electric bill” pitch misleading. Dave went this route — financed his Sunrun system at 7.49% and is fine with it long term. But he told me he wishes someone had shown him the total interest number before he signed rather than after.
The honest framing: financed solar is a long-term asset play, not an immediate cash-flow improvement. If you’re expecting to see savings on month one, cash or a home equity loan typically gets you there. A solar-specific loan typically doesn’t.
What I’d Tell Anyone Starting This Calculation
Run the math for your specific situation before you talk to a single installer. Know your annual kWh usage, your utility’s current rate, and your approximate federal tax liability for the install year.
With those three numbers, you can back-calculate what system size makes sense, what your real payback period looks like at your rate, and how much of the tax credit you’ll actually be able to use in year one.
The rest of the quote process is a lot easier when you walk in knowing what you’re looking for — rather than relying on the installer to tell you.
— Allen
