
My first post-solar electricity bill was $22.
The bill before the panels turned on had been $310. I remember standing at the kitchen counter reading it, doing the math twice because it seemed wrong. Claire walked in and asked why I was staring at the mail. I showed her the number. She said: “That’s less than our Netflix subscriptions.”
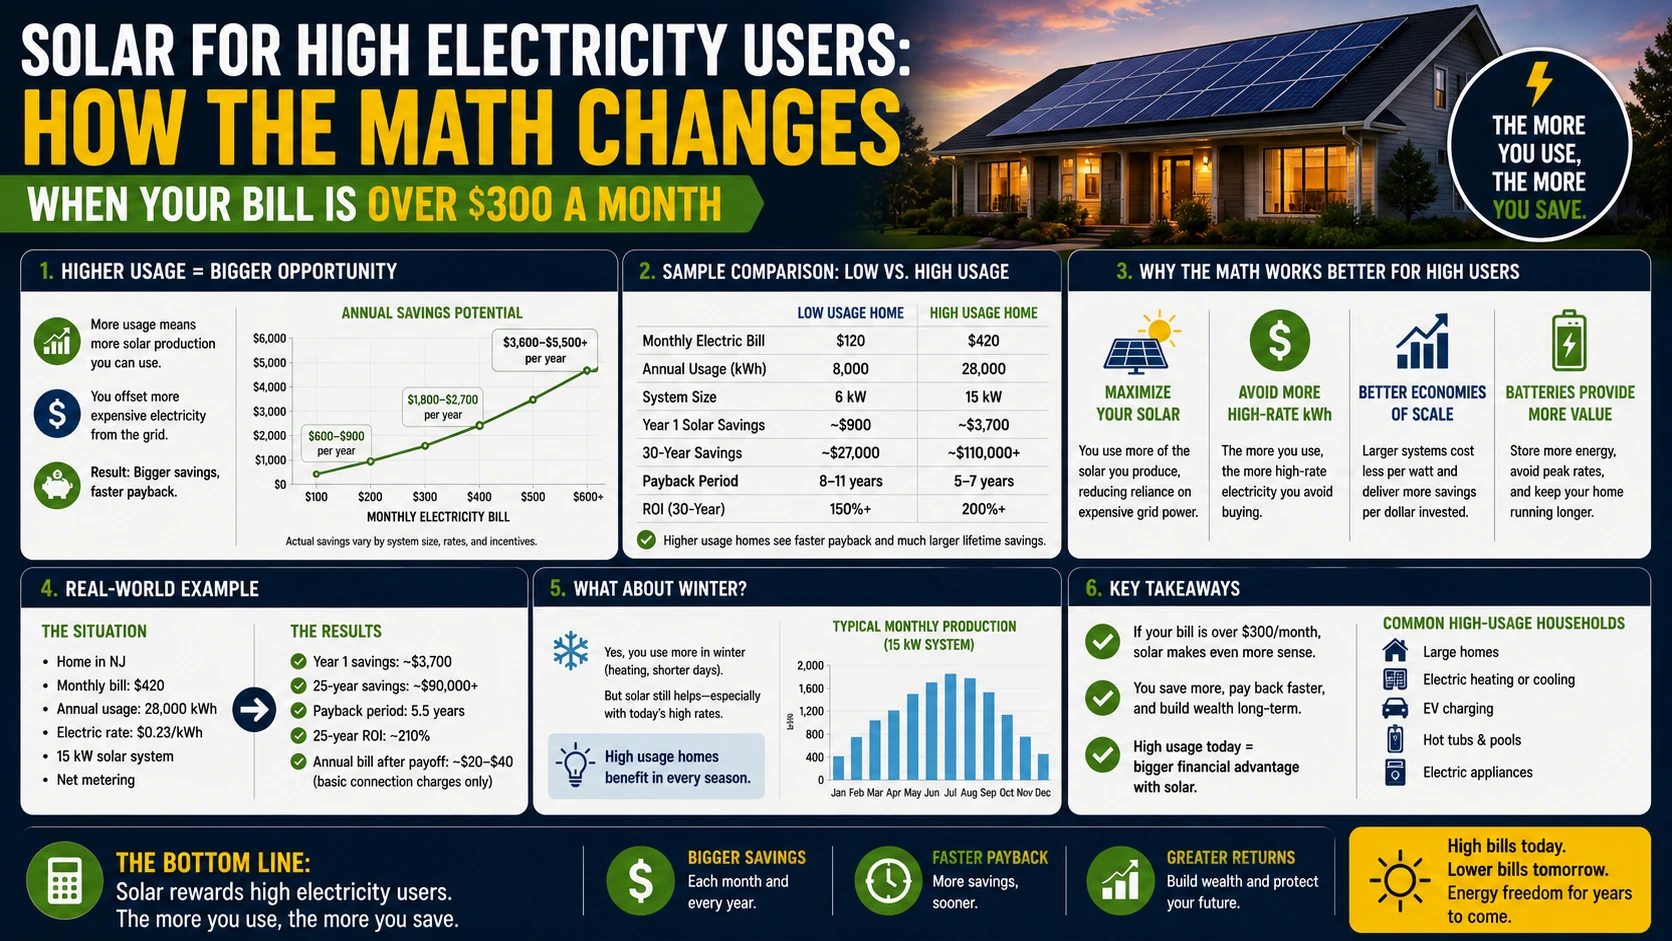
That $288 monthly swing — $3,456 per year — is why high electricity users get disproportionately good solar returns. The financial case for solar scales directly with how much electricity you consume, and the households with the most to gain are precisely the ones with the biggest bills.
Why High Usage Improves the Economics
The core logic is simple: a solar system’s installed cost is relatively fixed based on system size, but the savings it generates scale with electricity consumption and rate. A household spending $150/month on electricity and a household spending $350/month can install similarly sized systems — but their annual savings differ by $2,400 and their payback periods differ by years.
Here’s the math laid out cleanly:
Household A — $150/month bill ($1,800/year), Austin TX:
- System to cover 80% of usage: ~5.5kW
- Net system cost (after 30% ITC): ~$11,500
- Annual savings: ~$1,440 (80% of $1,800)
- Payback: 8.0 years
Household B — $310/month bill ($3,720/year), Austin TX — my pre-solar situation:
- System to cover 95% of usage: 9.6kW
- Net system cost (after 30% ITC): ~$19,747
- Annual savings: ~$3,444
- Payback: 5.7 years
The high-usage household pays 72% more for the system but saves 139% more per year, resulting in a payback period 2.3 years shorter. The solar math accelerates with consumption.
This is why installers like to work with high-usage customers — the systems are larger, margins are better, and the customer satisfaction is higher because the bill reduction is dramatic and visible. It’s one of the few cases where the installer’s financial interest and the homeowner’s align perfectly.
What Drives a High Electricity Bill
Before going solar, it’s worth understanding what’s driving your usage, because it affects how you size the system and whether any efficiency measures make sense alongside solar.
Central air conditioning in hot climates: The single biggest residential electricity load in Texas, Florida, Arizona, and most of the South. A 3-ton central AC unit running 8 hours/day in Austin July at 1,500W draws roughly 12 kWh/day — just from the AC. If your home has a poorly sealed attic, old insulation, or leaking ducts, you’re generating heat faster than your AC removes it, which compounds the problem.
Electric water heating: A standard electric resistance water heater draws 4–5 kW and runs roughly 2–4 hours daily — 8–20 kWh/day. If you have a large household or older water heater, this is a significant load that solar can directly offset.
Electric vehicle charging: I added about 3,257 kWh/year to my consumption with the Bolt EV — roughly 27% of my household electricity use. The full EV + solar math I covered separately, but the short version: an EV is one of the best reasons to size up your solar system.
Pool and spa equipment: A 1.5 HP pool pump running 8 hours/day draws roughly 12–15 kWh/day — comparable to central AC. Homes with pools in hot climates are among the highest electricity consumers in any market.
Electric heat (resistance or heat pump): In climates that use electric resistance heat, winter bills can rival summer AC bills. Heat pumps are far more efficient and can dramatically reduce heating consumption before or alongside solar.
Large homes / older construction: Poorly insulated homes, older appliances, and large square footage all compound consumption. If your home is pre-1990 construction in a hot climate with original HVAC, the true highest-ROI sequence might be: insulation upgrade → efficient HVAC → solar. Each step makes the next one more cost-effective.
Sizing the System for High Usage: Don’t Under-Build
The most common mistake I see high-usage homeowners make: they look at the system cost, feel sticker shock, and ask the installer to size down to hit a lower total price — then are surprised when the system covers only 60–70% of their bill.
A 70% coverage system is not a bad system. But if your goal is to minimize your annual electricity cost, the economics of the additional panels are typically favorable. Here’s why:
Additional panels beyond a baseline system are incrementally cheaper — the fixed costs of permits, labor, interconnection, and system hardware have already been covered. Going from a 7kW to a 9.6kW system might add $4,500 in cost but add $900/year in incremental savings. That marginal investment pays back in 5 years, independent of what the base system does.
The counterpoint: in utilities with reduced export rates (California’s NEM 3.0, APS in Arizona), oversizing beyond your consumption produces diminishing returns because the excess exports at below-retail credit rates. In full retail net metering markets (Texas, New Jersey, New York), oversizing is nearly always economically sound.
My recommendation for high-usage homeowners: tell every installer your actual average monthly consumption and your peak month consumption (typically the hottest summer month). Ask them to size the system to cover 95–100% of your annualized usage. Then ask them to show you the production model with those numbers — not a standard “average-home” estimate.
The EV Factor for High-Usage Homeowners
If you have an EV — or are planning to get one in the next 3–5 years — size your solar system to cover the EV’s electricity demand on day one.
Most installers, if not prompted, size for your current historical consumption. Adding an EV after install means the system that fully offset your home electricity now only covers 70–75% of your total consumption. Going back for additional panels costs more per watt than doing it at original install because you’re paying fixed costs (permits, service calls, roof staging) again.
My installer knew about the Bolt and sized the 9.6kW system accordingly. The marginal additional panels for the EV added roughly $2,100 to the system cost. The annual savings from covering EV charging from solar — about $381/year that would otherwise go to grid electricity — pays that back in 5.5 years. If I’d sized the system for house-only and then tried to add panels two years later, the economics would have been noticeably worse.
The sizing rule for EV + solar: Add the EV’s annual kWh consumption to your home’s annual consumption before the installer models system size. My Bolt needs ~3,257 kWh/year. That addition effectively required about 2.1 more kilowatts of panel capacity than the house-only calculation. Worth it by a significant margin.
The High-Usage Homeowner’s Payback Calculation
Let me walk through the actual numbers for the three most common high-usage profiles:
The hot-climate AC-heavy home ($280–350/month):
- Annual consumption: ~24,000–30,000 kWh
- System size needed: 14–18 kW (may require two roof sections or ground mount)
- Net cost after ITC: $32,000–$42,000
- Annual savings: $3,360–$4,200 at $0.14/kWh average
- Payback: 8–10 years (longer due to larger system, but savings are substantial)
- 25-year savings: $84,000–$105,000+
The EV + home combination ($250–320/month total):
- Annual consumption: ~22,000–27,000 kWh
- System size: 13–16 kW
- Net cost after ITC: $29,000–$37,000
- Annual savings: $3,080–$3,780 at $0.14/kWh average
- Payback: 7.7–9.8 years
- 25-year savings: $77,000–$94,000+
The pool + AC home in hot climate ($350–500/month):
- Annual consumption: 36,000–50,000 kWh
- System size: 20–28 kW (likely requires ground mount or multiple roof sections)
- Net cost after ITC: $42,000–$58,000
- Annual savings: $5,040–$7,000 at $0.14/kWh average
- Payback: 8–8.3 years
- 25-year savings: $126,000–$175,000+
The pool + AC home shows something important: when bills are very high, the long-term savings become very large — and the payback period doesn’t extend proportionally because the system can be sized to cover the consumption efficiently.
The Efficiency Question: Should You Reduce First?
A common question: “Should I reduce my consumption before sizing for solar, or size for my current consumption?”
The honest answer: it depends on the efficiency measure.
Easy, cheap efficiency wins you should do first: LED lighting (already done by most), smart thermostat ($150–250, typically 8–12% AC reduction), air sealing obvious gaps in attic penetrations and around doors. These cost $500–1,500 and have immediate payback — and they reduce the system size you need, which is a proportional cost reduction.
Expensive efficiency upgrades (HVAC replacement, major insulation, window replacement): These cost $8,000–25,000 and reduce your bill, but they don’t reduce your solar payback proportionally because you’re now deploying $10,000+ to reduce the system size — and the solar system itself would have delivered that savings anyway. The calculus here is case-specific.
My approach: I fixed the easy stuff (smart thermostat, LED bulbs, sealed the attic hatch) before the solar install. I sized the solar system for my post-easy-efficiency consumption, not for the hypothetical post-major-renovation consumption I might achieve someday. The major stuff — HVAC was only 3 years old, insulation was adequate — wasn’t worth disrupting.
The one combination that’s genuinely compelling: Replacing an aging electric resistance water heater with a heat pump water heater ($1,000–1,500 installed) before your solar consultation. This single appliance swap typically reduces water heating electricity by 60–70%, which is 3–6 kWh/day, which means 2–3 fewer kilowatts of solar panels needed. On a 9.6kW system, that’s a meaningful cost reduction on a low-cost efficiency investment.
From $310 to $22: What the First Year Actually Looked Like
My pre-solar annual electricity spend was $3,720. Year one post-solar: $276 — and that included EV charging for the Bolt, which added roughly $381 in would-be grid electricity that the solar covered instead. The effective total benefit of solar in year one was approximately $3,825 against a net system cost of $19,747.
Year two was better. Electricity rates increased slightly; the Bolt drove more miles; the system performed within 0.8% of the original production estimate. The savings ticked up.
If your bill is $300/month or more, you’re in the category where solar has its strongest financial case. The size of the bill you’re replacing is the size of the savings you’re generating. Every dollar you currently send to your utility is a dollar you could be keeping — and the payback period on redirecting it is one of the better financial investments available to a US homeowner in 2025.
The full cost breakdown of my system shows exactly what I paid and what I got back. The numbers that worked for my $310/month bill will look even better if yours is higher.
— Allen
